Situation
There are two products (services) that represent two affiliate strategies.
- First: attracting large amounts of FTDs at relatively high marketing cost with low growth and near flat margins on a maturity stage.
- Second: low quantity (twice as low actually), lower marketing spend but high growth and pricing power.
Revenue Build uses real or close to real data that you can manipulate yourself.
Product 1 average LTV on a per-quarter basis is €186, Product 2 - €208: starting from the same value of €170, pricing growth (LTV) is capitalised on Q4 in the former case whereas product 2 uses LTV that changes quarterly.
For the purpose of discussion, the rise of LTV (pricing growth) is a function of time in both products, but also a measure of effectiveness of the affiliate marketing team (brand awareness overall, liaison making, relations building + RD).
Each of Products use Cost Fixed (rent, use of softwares, salaries, etc) as well as Costs Variable, i.e. CAC (Prepay, CPA and RS).
Model uses 6 Quarters.
Definition of terms
FINANCIAL MODEL
Revenue Build
--- --- --- --- --- --- --- --- --- --- --- --- --- --- --- ---
LTV amount:
- It's essential, the same as 'price' in unit economics.
- If you start out, to build a model you may take €750 as a dummy for Tier 1 and €300 for Tier 2.
- If you have your data, fill in.
- If you don't know what to do, take your revenue and divide by your number of players.
LTV life span:
- Based on practice, I use an average player's life span of 1 year (4 quarters) in a model.
- If the LTV estimate is conservative (low), the LTV of the following period rises.
- I capitalise its rise in LTV once a year (Q4).
LTV change:
- Normally, the LTV rises with time by each publisher: its function of greater brand awareness, a liaison with a publisher, etc.
- When you actively work on relations, LTV rises more drastically.
Costs fixed:
- Per-unit basis. Example of calculation of costs fixed is laid down here: https://mycasinoindex.com/reports/how-to-do-online-casino-marketing
- For the theory see Investodedia
Marketing cost, CAC (Prepay + CPA):
- Per-unit basis. Prepay (PP) is an amount paid to a publisher as an entry fee or equivalent.
- CPA is an amount paid for each actual FTD as a part of CPA + RS deal.
Marketing cost, RS:
- Revenue Share part is taken by 30%GGR on average (if you have your data, fill in).
- RS to GGR = RS*(NGR + Admin Costs).
Total Variable Cost (CAC): PP + CPA + RS%GGR.
--- --- --- --- --- --- --- --- --- --- --- --- --- --- --- --
Income Statement
--- --- --- --- --- --- --- --- --- --- --- --- --- --- --- ---
Revenue:
- LTV x Number of FTDs.
- As LTV of players are accrued, revenue rises by quarter, evidently at least until Q4.
Variable Costs: Marketing cost, CAC (Prepay + CPA) incurred to obtain a FTD (one time) + RS (ongoing, as a percentage of Revenue)
Gross profit: Revenue - Costs (Fixed + Variable)
SG&A: Operating expenses—also known as selling, general and administrative expenses (SG&A) — are the costs of doing business. These also include platform fees (in case of white label / turnkey casino platform).
EBITDA:Gross Profit - SG&A
--- --- --- --- --- --- --- --- --- --- --- --- --- --- --- --
KEY RATIOS
Product Operations Ratios
--- --- --- --- --- --- --- --- --- --- --- --- --- --- --- ---
Units growth, Pricing growth: growth by quarter, capitalised on Q4 (Product 1)
ROAS:
- Definition: Revenue / Variable Costs (PP + CPA + RS).
- Significance: Shows effectiveness of your spending on player acquisition.
Gross Profit Margin:
- Definition: The gross profit margin is the percentage of revenue that exceeds the COGS (Costs Fixed + Variable). A high gross profit margin indicates that a company is successfully producing profit over and above its costs.
- Significance: The higher the number, the more efficient management is in generating profit for every euro of cost involved.
LTV/CAC:
- Definition: compares the value of a customer over their lifetime to the cost of acquiring them.
- Significance: If the LTV/CAC ratio is less than 1.0, the company is destroying value.
Unit Contrib Margin:
- Definition: represents the portion of a sales revenue that isn't used up by variable costs, and so contributes to covering the company's fixed costs.
- Significance: It provides one way to show the profit potential of a particular product offered by a company and shows the portion of sales that helps to cover the company's fixed costs. Any remaining revenue left after covering fixed costs is the profit generated.
--- --- --- --- --- --- --- --- --- --- --- --- --- --- --- --
Business Operations Ratios
--- --- --- --- --- --- --- --- --- --- --- --- --- --- --- ---
EBITDA Margin:
- Definition: EBITDA / Revenue.
- Significance: Calculating a company's EBITDA margin is helpful when gauging the effectiveness of a company's cost-cutting efforts. The higher a company's EBITDA margin is, the lower its operating expenses are in relation to total revenue. The EBITDA margin tells analysts how much operating cash is generated for each euro of revenue earned. That number can then be used as a comparative benchmark.
DISCUSSION
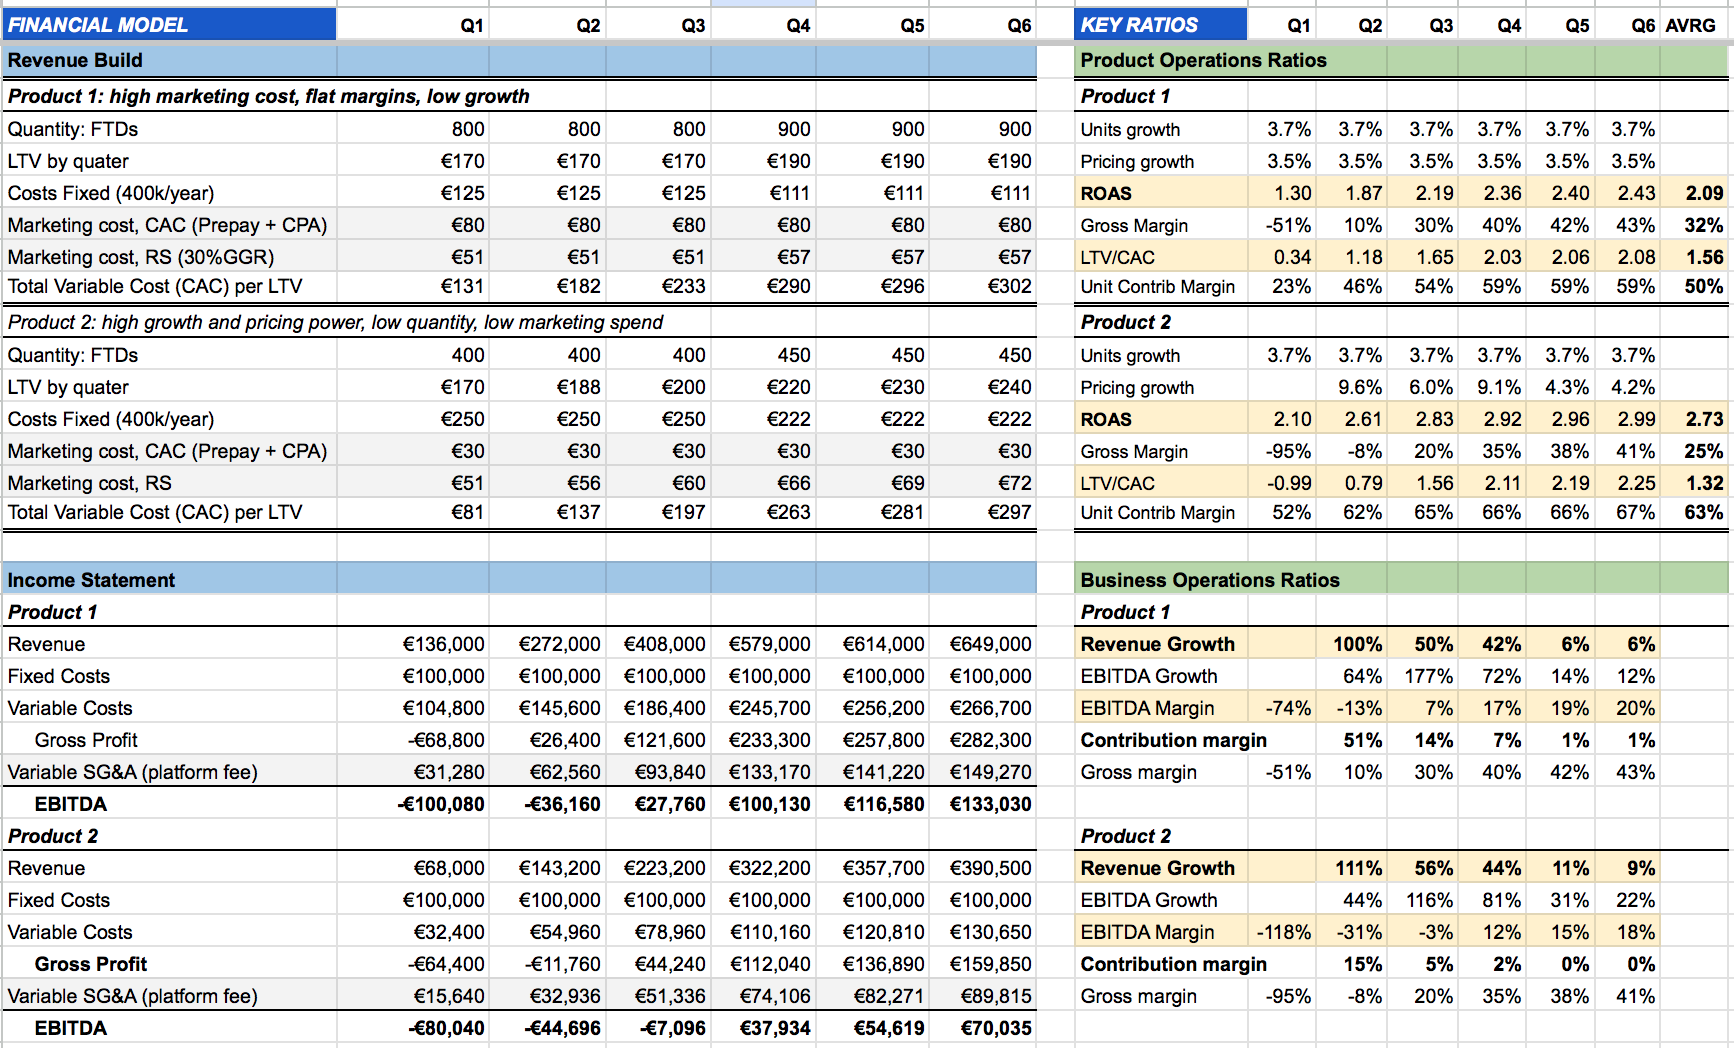
Product 2 attracts 400 FTDs per quarter with a rise to 450 from quarter 4 (+3.7% per quarter). Product 1 does the double, i.e. 800 FTDs with the same unit growth dynamics. If you'd look at the 'Product 2: Costs fixed', it's €275,000 versus €400,000: the difference of 125,000 yearly or €10,426/mo by the legend is attributable to lower size of affiliate marketing team (only 2 affiliate manager) and the absence of a linear manager. Yet, 'Product 2: Platform fee + selling expenses' is 2% higher, which is a success fee to a team.
Both products start from €170 per-quarter LTV of a player, which is €680 annualised. By our convention, the full players' LTV is realiasable in 1 year or 4 quarters (if it's not the case, it will add up to the LTV of the succeeding quarter). Likewise, product 1 has an actual annualised LTV of €700, whereas Product 2 - €778, a difference of 11%.
Cost fixed per-unit of FTDs are lower with product 1 that recruits twice as many players as Product 2: €118 -vs- €162. Average Revenue Share per-unit is GGR 30% (NGR 40% at 25% admin costs) is the same for two. Product 1 uses Marketing cost or CAC (Prepay + CPA) of €30 + €50 per per-unit or FTD. Product 1 uses €30 prepay only per-unit or FTD. A lower CAC with Product 2 is responsible for lower quantity, whereas higher effectiveness of partnership building is responsible for higher LTV.
Pricing growth (LTV premium) with Product 2 is 6.6% on average per quarter as compared to 3.5% of Product 1. With Product 2 the ROAS starts at €2 and goes all the way to almost €3 of revenue per €1 spend of acquisition in quarter 6, which is a very solid result. Overall, although the Costs Fixed per unit are significantly higher (+37%), the Product 2 Gross Profit Margin looks better due to a higher Unit Contrib Margin (63% with Product 2 as compared to 50% with Product 1 on average).
Product 1 business break even is the end of the 12th month of operations. Product 2 business break even is the end of 10th month of operations. Business Break Even = Fixed costs / Gross profit margin. Product 1 need for investment to start over is €736,800 whereas almost twice lower - €373,570.
Product 1 has flat margins starting Q4 onwards as the LTV of the portfolio of FTDs is realised to the fullest: it does not grow any longer. In fact, it shows a limit of growth of margins and may even point in a direction of decrease unless the affiliate marketing team finds a way to lower CAC or increase LTV. This is a pivotal point where a shift in strategy shall take place.
Product 2 has much better dynamics: the company is probably at least 2 quarters ahead of the situation of Product 1. It means they have more time to choose their next move: 1) attract even higher LTV players, though low in numbers but by lower CAC (a 'niche' brand), 2) attract more FTDs by higher marketing costs and try to retain LTV (scale-up) or otherwise.